Consmin, a leading manganese ore producer with mining operations in Ghana and Australia, announces its quarterly results for the period ended 30 September 2016.
Market and Liquidity Update
Key Highlights
| Quarter ended | Nine months ended | |||||
|---|---|---|---|---|---|---|
| Unaudited | 30 Sept 2016 |
30 Sept 2015 |
% change | 30 Sept 2016 |
30 Sept 2015 |
% change |
| Manganese ore produced (dry kt) | 564.6 | 679.5 | (16.9%) | 1,515.0 | 2,160.5 | (29.9%) |
| Manganese ore sales (dry kt) | 698.9 | 890.9 | (21.6%) | 1,817.2 | 2,166.0 | (16.1%) |
| Average C1 manganese unit cash cost ($/dmtu)1 | 1.22 | 2.20 | (44.5%) | 1.40 | 2.05 | (31.7%) |
| Average manganese FOB Sales price ($/dmtu) | 1.61 | 2.42 | (33.5%) | 1.85 | 2.77 | (33.2%) |
| Revenue ($ million) | 31.5 | 75.2 | (58.1%) | 100.4 | 218.0 | (53.9%) |
| Adjusted EBITDA ($ million)2 | 1.2 | 4.0 | (70.0%) | (5.0) | 43.0 | (111.6%) |
| ‘Cash’ EBITDA ($ million)2 | 5.9 | 17.0 | (65.3%) | 10.3 | 33.9 | (69.6%) |
| (Loss) / profit for the period | (29.4) | (14.6) | (101.4%) | (73.9) | 3.9 | (1994.9%) |
| At 30 Sept 2016 | At 31 Dec 2015 | % change | |
|---|---|---|---|
| Cash and cash equivalents ($ million) | 36.4 | 79.1 | (54.0%) |
| Gross debt ($ million) | (399.5) | (390.3) | 2.4% |
| Gross debt excluding high yield bonds ($ million) | (8.4) | (17.2) | (51.2%) |
| Net debt ($ million) | (363.1) | (311.2) | 16.7% |
1 Average C1 manganese unit cash cost represents the cash cost incurred at each processing stage from mining through to shiploading, divided by the total manganese dmtus produced. Included within the C1 manganese cash costs are an allocation of offsite, non-corporate and support services. Depreciation, government royalty payments, deferred stripping adjustments and stockpile movements are not included in the calculation.
2 “Adjusted EBITDA” is defined as operating profit before depreciation and amortisation, impairment write-back/expense, net foreign exchange gain/loss and exceptional items3. ‘Cash’ EBITDA is defined as Adjusted EBITDA after removing the impact of the non-cash items of deferred stripping and net movement in inventories. Adjusted EBITDA and Cash EBITDA are the key profitability measures used across the business and reflect performance in a consistent manner and in line with how the business is managed and measured on a day to day basis. Adjusted EBITDA and Cash EBITDA are not uniformly or legally defined measures and are not recognised under IFRS or any other generally accepted accounting principles. Other companies in the mining industry may calculate these measures differently and consequently, our presentation of Adjusted EBITDA and Cash EBITDA items may not be readily comparable to other companies’ figures.
3 Exceptional items are material or non-recurring items excluded from management’s assessment of profits because by their nature they could distort the Group’s underlying quality of earnings. These are excluded to reflect performance in a consistent manner and in line with how the business is managed and measured on a day to day basis.
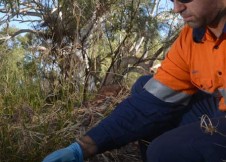
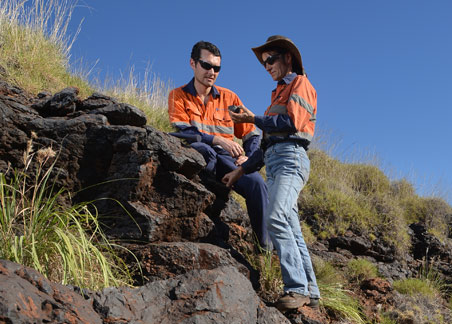
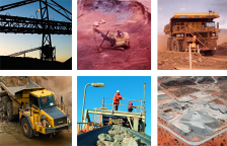
“Production in the quarter from our Nsuta mine in Ghana increased 29% compared to the corresponding period in 2015 underpinned by continuing improved demand for the Company’s Ghanaian ore. Total production for the Consmin Group however decreased 17% during the third quarter of 2016 compared to the corresponding period in 2015. This reduction was due to the Australian Woodie Woodie being on care and maintenance since Q1 2016. As a result production from Australia was 91% lower in the quarter with production only relating to limited processing of remaining ROM stockpiles.
The manganese C1 cash cost for the quarter was $1.22/dmtu, an improvement of 45% from $2.20/dmtu for Q3 2015. The C1 cash cost for Q3 2016 does not include any costs or production from the Australian operations which were on care and maintenance.
Sales tonnes from Ghana were nearly 700k dry tonnes, being 35% higher than in Q3 2015. There were no shipments of Australian manganese ore during the quarter.
The quarterly average 44% benchmark CIF price for manganese lump in Q3 2016 was $4.00/dmtu, up 32% from $3.03/dmtu in Q2 2016. Manganese ore prices in 2016 started the year at multi year lows and then rose in the second and early third quarter on the back of supply curtailments and reduced imports into China. Price rises were also supported by better than expected steel performance in China, however increased imports in Q2, causing prices to decline in August and September. However, due to recent logistical issues in South Africa (the biggest manganese ore exporting country), prices have surged since October and are now on track to finish the year at multi-year highs of over $6.00/dmtu. Other factors driving prices to these high levels are stockpiling prior to the Chinese New Year holiday, which begins on January 28th 2017, and accumulating and holding of spot material by traders at China ports leveraging supply disruptions.
The company is positive towards the better performance of manganese ore prices in late 2016 but remains cautious on the ensuing volatility. Such high prices are attracting an increase of supply of non-mainstream ores, both domestically in China and from abroad, which are attractive as lower grade cheaper options to mainstream ores. As a result, prices will likely lose momentum once stockpiling is completed and more ore arrives in China, assuming South Africa solves its logistical issues in the near term. Although we expect prices to soften, we feel they should not return to the lows experienced at the beginning of 2016 but rather find a new sustainable price range, supported by market fundamentals.
As noted in the previous quarter’s result, on 15 August the Company announced the successful conclusion to the consent solicitation process, having received consents from 96.43% of the Noteholders. The Company would like to thank the majority of Holders for their support and notes the beneficial effect that these amendments will have in providing the Company with significant additional liquidity during the current period of low and volatile manganese prices.
On 15 November the Company announced that its ultimate beneficial owner and direct shareholders (“Sellers”) had entered into a share purchase agreement (“SPA”) with China Tian Yuan Manganese Limited (“Purchaser”), a subsidiary of Ningxia Tianyuan Manganese Industry Co., Ltd. (“TMI”) pursuant to which the Sellers agreed to sell and transfer to the Purchaser all of their respective right and title to both the entire share capital of the Company and the shareholders funding given by them to the Company (the “Transaction”).
The Transaction is conditional upon a number of conditions which are set out in the SPA, including, but not limited to certain government consents, certain consents from the holders of the then outstanding US$400,000,000 8% Senior Secured Notes due 2020 (the “Notes”) and the execution of an offtake agreement between Manganese Trading Limited, a subsidiary of the Company, and Grizal Enterprises Limited (a “Seller” in the Transaction) (“Grizal”) which will become effective simultaneously with completion of the Transaction (the “Offtake Agreement”). The Offtake Agreement provides that Grizal may, in its absolute discretion, purchase from MTL, in any calendar year, up to 600kt of Ghanaian Manganese Ore for a period of ten years from completion of the Transaction. If the conditions to the Transaction are not satisfied or waived within the period of six months from the signing, the SPA shall terminate and the Transaction will not complete.”
Download the full Report for the Third Quarter ending 30 September 2016 (PDF) – Consmin Quarterly Report – Q3 2016
Consmin is a leading manganese ore producer within mining operations in Australia and Ghana. The principal activities of the Company and its subsidiaries (the “Group”) are the exploration, mining, processing and sale of manganese products. The Group’s operations are primarily conducted through four major operating/trading subsidiaries: Pilbara Manganese Pty Limited (Australia), Ghana Manganese Company Limited (Ghana), Manganese Trading Limited (Jersey) and Pilbara Trading Limited (Jersey).
Consolidated Minerals Limited is headquartered in Jersey and the address of its office is Commercial House, 3 Commercial Street, St Helier, Jersey, Channel Islands, JE2 3RU.
For further information, please visit our website www.consmin.com or contact:
Mark Camaj, General Manager, Marketing
Jurgen Eijgendaal, Managing Director, Ghana
David Slater, Executive Director and CFO
There will be a conference call for analysts and bondholders, the details of which are released through the Company website www.consmin.com.
Market, economic and industry data used throughout this report has been derived from various industry and other independent sources. Industry publications, surveys and forecasts generally state that the information contained therein has been obtained from sources believed to be reliable, but that the accuracy and completeness of such information is not guaranteed and such industry forecasts may not have been updated. Forecasts and other forward-looking information obtained from these sources are subject to the same qualifications and uncertainties as the other forward looking statements contained in this report.
This report includes “forward-looking statements” that express or imply expectations of future events or results. Forward-looking statements are statements that are not historical facts. These statements include, without limitation, financial projections and estimates and their underlying assumptions, statements regarding plans, objectives and expectations with respect to future production, operations, costs, products and services, and statements regarding future performance. Forward-looking statements are generally identified by the words ‘plans,’ ‘expects,’ ‘anticipates,’ ‘believes,’ ‘intends,’ ‘estimates’ and other similar expressions.
All forward-looking statements involve a number of risks, uncertainties and other factors. Although Consmin’s management believes that the expectations reflected in such forward-looking statements are reasonable, investors are cautioned that forward-looking information and statements are subject to various risks and uncertainties, many of which are difficult to predict and generally beyond the control of Consmin, that could cause actual results and developments to differ materially from those expressed in, or implied or projected by, the forward-looking information and statements contained in this report. Factors that could cause or contribute to differences between the actual results, performance and achievements of Consmin include, but are not limited to, political, economic and business conditions, industry trends, competition, commodity prices, changes in regulation, currency fluctuations (including the Australian dollar and US dollar exchange rates), Consmin’s ability to recover its reserves or develop new reserves, including its ability to convert its resources into reserves and its mineral potential into resources or reserves, and to timely and successfully process its mineral reserves which may or may not occur. Consmin is also exposed to the risk of trespass, theft and vandalism, changes in its business strategy, as well as risks and hazards associated with the business of mineral exploration, development, mining and production. Accordingly, investors should not place reliance on forward looking statements contained in this report.
The forward-looking statements in this report reflect information available at the time of preparing this report. Subject to the requirements of the applicable law, Consmin explicitly disclaims any obligation or undertaking publicly to release the result of any revisions to any forward- looking statements in this report that may occur due to any change in Consmin’s expectations or to reflect events or circumstances after the date of this report. No statements made in this report regarding expectations of future profits are profit forecasts or estimates, and no statements made in this report should be interpreted to mean that Consmin’s profits for any future period will necessarily match or exceed the historical published profits of Consmin or any other level.