Consmin, a leading manganese ore producer with mining operations in Australia and Ghana, announces its quarterly results for the period ended 30 June 2016.
Market and Liquidity Update
Key Highlights
| Quarter ended | Six months ended | |||||
|---|---|---|---|---|---|---|
| Unaudited | 30 June 2016 |
30 June 2015 |
% change | 30 June 2016 |
30 June 2015 |
% change |
| Manganese ore produced (dry kt) | 560.7 | 767.2 | (26.9%) | 950.4 | 1,481.0 | (35.8%) |
| Manganese ore sales (dry kt) | 628.0 | 700.1 | (10.3%) | 1,118.2 | 1,275.1 | (12.3%) |
| Average C1 manganese unit cash cost ($/dmtu)1 | 1.30 | 1.99 | (34.7%) | 1.52 | 1.98 | (23.2%) |
| Average manganese FOB Sales price ($/dmtu) | 2.41 | 2.47 | (2.4%) | 1.99 | 3.01 | (33.9%) |
| Revenue ($ million) | 47.5 | 61.0 | (22.1%) | 68.9 | 142.8 | (51.8%) |
| Adjusted EBITDA ($ million)2 | 2.7 | 14.9 | (81.9%) | (6.2) | 39.0 | (115.9%) |
| ‘Cash’ EBITDA ($ million)2 | 15.6 | 0.8 | 1,850.0% | 4.4 | 16.9 | (74.0%) |
| (Loss) / profit for the period | (11.3) | 22.0 | (151.4%) | (44.5) | 18.5 | (340.5%) |
| At 30 June 2016 | At 31 December 2015 | % change | |
|---|---|---|---|
| Cash and cash equivalents ($ million) | 55.3 | 79.1 | (30.1%) |
| Gross debt ($ million) | (384.6) | (390.3) | (1.5%) |
| Gross debt excluding high yield bonds ($ million) | (10.2) | (17.2) | (40.7%) |
| Net debt ($ million) | (329.3) | (311.2) | 5.8% |
1 Average C1 manganese unit cash cost represents the cash cost incurred at each processing stage from mining through to shiploading, divided by the total manganese dmtus produced. Included within the C1 manganese cash costs are an allocation of offsite, non-corporate and support services. Depreciation, government royalty payments, deferred stripping adjustments and stockpile movements are not included in the calculation.
2 “Adjusted EBITDA” is defined as operating profit before depreciation and amortisation, impairment write-back/expense, net foreign exchange gain/loss and exceptional items3. ‘Cash’ EBITDA is defined as Adjusted EBITDA after removing the impact of the non-cash items of deferred stripping and net movement in inventories. Adjusted EBITDA and Cash EBITDA are the key profitability measures used across the business and reflect performance in a consistent manner and in line with how the business is managed and measured on a day to day basis. Adjusted EBITDA and Cash EBITDA are not uniformly or legally defined measures and are not recognised under IFRS or any other generally accepted accounting principles. Other companies in the mining industry may calculate these measures differently and consequently, our presentation of Adjusted EBITDA and Cash EBITDA items may not be readily comparable to other companies’ figures.
3 Exceptional items are material or non-recurring items excluded from management’s assessment of profits because by their nature they could distort the Group’s underlying quality of earnings. These are excluded to reflect performance in a consistent manner and in line with how the business is managed and measured on a day to day basis.
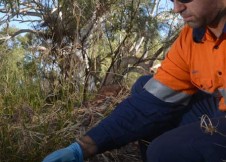
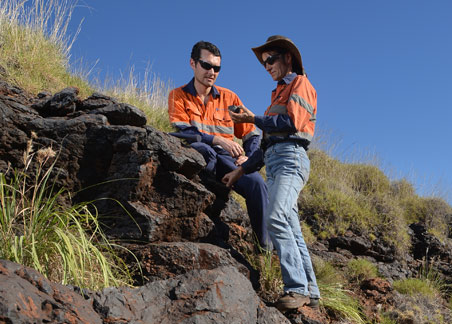
“During the second quarter of 2016 Consmin’s production decreased by 27% compared to the corresponding period in 2015. This reduction was due to the decision taken to suspend operations at the Australian Woodie Woodie mine with effect from 2nd February 2016 and commence the transition into care and maintenance. As a result production from Australia was 72% lower in the quarter with production only relating to limited processing of remaining ROM stockpiles. Production from our Nsuta mine in Ghana in the quarter, however, increased 15% compared to the corresponding period in 2015 underpinned by improved demand for the Company’s Ghanaian ore.
The manganese C1 cash cost for the quarter was $1.30/dmtu, an improvement of 35% from $1.99/dmtu for Q2 2015. The C1 cash cost for Q2 2016 does not include any costs or production from the Australian operations due to them being placed on care and maintenance.
The company’s manganese ore shipments totalled 628k dry tonnes during Q2 2016, a decrease of 10% compared to Q2 2015. Shipments of Australian manganese ore were limited to existing stockpiles in place at the time of the suspension of operations with sales efforts focussing on maximising revenue due to the improved pricing seen in Q2 2016 in comparison to that in Q1 2016. Sales tonnes from Ghana were 4% lower than in Q2 2015 due to the planned final shipment of June 2016 slipping into the first few days of July 2016. Including this vessel, sales of Ghanaian ore surpassed 2 million tonnes on an annualised basis during the quarter, which is in line with the Ghana record sales levels achieved in 2013.
The quarterly average 44% benchmark CIF price for manganese lump in Q2 2016 was $3.03/dmtu, up 46% from $2.07/dmtu in Q1 2016. This significant price rise was attributable to a very substantial drawdown of China’s port stocks in Q1 2016, following the production curtailments from major ore suppliers, including the start of care and maintenance at our Woodie Woodie mine. As the result of an improvement in steel production and prices in China, ore suppliers were able to leverage reduced availability of manganese ore to push up prices aggressively, leading to high grade ore prices achieving levels over $4.00/dmtu in April and May. It should be noted that these price rises were not driven by market fundamentals but rather acute supply tightness and such prices began to unwind towards the end of Q2 with prices for high grade ores falling to below $3.00/dmtu for July shipments.
It seems likely that the recent price volatility will continue throughout the remainder of 2016 as market participants adjust to improved yet fragile steel prospects in China. Supplier discipline should continue to be the key factor although it remains difficult to predict. The Company is cautiously optimistic that the price lows seen in the early months of the year will not reoccur during the remainder of 2016.
Although the Company ended 2015 with net cash and cash equivalents of $76 million, the weakness of pricing for manganese ore in Q1 2016, as well as the costs associated with placing the Woodie Woodie mine into care and maintenance put further pressure on liquidity, with the Company’s net cash and cash equivalents having reduced to US$39 million at 31 March 2016. As a result of the level and speed of depletion of the Group’s liquidity the Company announced on 8 March 2016 that it anticipated discussions with holders of the 8.000% Senior Secured Notes due May 15, 2020 regarding these Notes, with discussions commencing in April 2016 to implement a solution to improve the Company’s liquidity.
Following the announcement of its engagement with the noteholder committee the Company announced that it had elected to utilise the 30 day coupon grace period to further discussions and would not pay the coupon payment due on 15 May 2016. In June the Company announced it had entered into the Standstill and Lock-up Agreement with Noteholders representing 83% of the outstanding Notes who had agreed to support certain amendments to the Notes through a consent solicitation process. On 8 July the Company further announced an invitation to noteholders to consent to certain modifications of the terms and conditions of the Notes.
On 15 August the Company announced that it had received consents from 96.43% of the Noteholders and as a result is pleased with the outcome of the consent solicitation process and thanks the majority of Holders for their support. These amendments will have the beneficial effect of providing the Company with significant additional liquidity during the current period of low and volatile manganese prices.”
Download the full Report for the Second Quarter ending 30 June 2016 (PDF) – Consmin Quarterly Report – Q2 2016
Consmin is a leading manganese ore producer within mining operations in Australia and Ghana. The principal activities of the Company and its subsidiaries (the “Group”) are the exploration, mining, processing and sale of manganese products. The Group’s operations are primarily conducted through four major operating/trading subsidiaries: Pilbara Manganese Pty Limited (Australia), Ghana Manganese Company Limited (Ghana), Manganese Trading Limited (Jersey) and Pilbara Trading Limited (Jersey).
Consolidated Minerals Limited is headquartered in Jersey and the address of its office is Commercial House, 3 Commercial Street, St Helier, Jersey, Channel Islands, JE2 3RU.
For further information, please visit our website www.consmin.com or contact:
Mark Camaj, General Manager, Marketing
Jurgen Eijgendaal, Managing Director, Ghana
David Slater, Executive Director and CFO
There will be a conference call for analysts and bondholders, the details of which are released through the Company website www.consmin.com.
Market, economic and industry data used throughout this report has been derived from various industry and other independent sources. Industry publications, surveys and forecasts generally state that the information contained therein has been obtained from sources believed to be reliable, but that the accuracy and completeness of such information is not guaranteed and such industry forecasts may not have been updated. Forecasts and other forward-looking information obtained from these sources are subject to the same qualifications and uncertainties as the other forward looking statements contained in this report.
This report includes “forward-looking statements” that express or imply expectations of future events or results. Forward-looking statements are statements that are not historical facts. These statements include, without limitation, financial projections and estimates and their underlying assumptions, statements regarding plans, objectives and expectations with respect to future production, operations, costs, products and services, and statements regarding future performance. Forward-looking statements are generally identified by the words ‘plans,’ ‘expects,’ ‘anticipates,’ ‘believes,’ ‘intends,’ ‘estimates’ and other similar expressions.
All forward-looking statements involve a number of risks, uncertainties and other factors. Although Consmin’s management believes that the expectations reflected in such forward-looking statements are reasonable, investors are cautioned that forward-looking information and statements are subject to various risks and uncertainties, many of which are difficult to predict and generally beyond the control of Consmin, that could cause actual results and developments to differ materially from those expressed in, or implied or projected by, the forward-looking information and statements contained in this report. Factors that could cause or contribute to differences between the actual results, performance and achievements of Consmin include, but are not limited to, political, economic and business conditions, industry trends, competition, commodity prices, changes in regulation, currency fluctuations (including the Australian dollar and US dollar exchange rates), Consmin’s ability to recover its reserves or develop new reserves, including its ability to convert its resources into reserves and its mineral potential into resources or reserves, and to timely and successfully process its mineral reserves which may or may not occur. Consmin is also exposed to the risk of trespass, theft and vandalism, changes in its business strategy, as well as risks and hazards associated with the business of mineral exploration, development, mining and production. Accordingly, investors should not place reliance on forward looking statements contained in this report.
The forward-looking statements in this report reflect information available at the time of preparing this report. Subject to the requirements of the applicable law, Consmin explicitly disclaims any obligation or undertaking publicly to release the result of any revisions to any forward- looking statements in this report that may occur due to any change in Consmin’s expectations or to reflect events or circumstances after the date of this report. No statements made in this report regarding expectations of future profits are profit forecasts or estimates, and no statements made in this report should be interpreted to mean that Consmin’s profits for any future period will necessarily match or exceed the historical published profits of Consmin or any other level.